YouTube Audience Retention in 2026: The Complete Guide to Keeping Viewers Watching

Every YouTube growth guide mentions audience retention. Almost none of them go deep enough to actually fix it.
Search "how to improve YouTube audience retention" and you'll find the same advice recycled across hundreds of articles: hook viewers in the first 30 seconds, use pattern interrupts, check your retention graph. That covers maybe 10% of what actually determines how long people watch your videos. The other 90% lives in production decisions that most creators never think about, and that most guides never mention.
Think of audience retention like an iceberg. The tip above the waterline is what everyone talks about: your intro, your hook, your content selection, whether you add B-roll and graphics. Below the surface sit less obvious factors: how your pacing matches your audience type, whether your voiceover matches the visuals on screen, how long your transitions last between segments, what your music choice signals to the viewer. And at the very bottom sit the things almost nobody talks about: how your side characters affect whether people keep watching, whether you remind viewers what's at stake often enough, how your perceived authority shapes willingness to sit through your advice, and why unpredictable moments generate curiosity that carries retention through slower sections.
Most creators only fix the tip. Then they wonder why their retention barely moves.
YouTube audience retention is the percentage of your video that viewers watch before leaving. A 10-minute video with 40% audience retention means viewers watched about 4 minutes on average. And in 2025-2026, YouTube made retention matter even more. The algorithm shifted to what multiple sources call satisfaction-weighted discovery: retention now combines with post-watch surveys, repeat viewing behavior, and session signals to determine which videos get recommended.
Before creating content, check what's already holding attention in your niche. The TubeLab Chrome Extension is free and shows competitor video performance, monetization status, and estimated RPM with one click. If top creators in your niche hold viewers for 8+ minutes on 12-minute videos, the audience is willing to watch long content. If nobody holds attention past 3 minutes, the niche itself might have an audience retention ceiling you should know about before investing months of work.
This guide doesn't repeat the basics. It covers what YouTube audience retention actually measures, current benchmarks, how to read your retention graph as a diagnostic tool, and then goes deep on the production decisions below the surface of the iceberg that actually move the needle.
Understanding the metric matters because most creators confuse what YouTube tracks with what YouTube rewards.
Average view duration (AVD) is total watch time divided by total views. If 1,000 people watch your 10-minute video and the total watch time is 4,000 minutes, your AVD is 4 minutes.
Audience retention percentage is AVD as a fraction of video length. That 4-minute AVD on a 10-minute video equals 40% audience retention.
Here's where creators get confused: a 35% retention rate on a 30-minute video represents 10.5 minutes of watch time per viewer. A 60% audience retention rate on a 3-minute video represents 1.8 minutes. The shorter video has better audience retention percentage but dramatically less raw watch time. YouTube's algorithm considers both signals. Don't compare audience retention across different video lengths. Compare within similar ranges.
Audience retention alone used to be enough to trigger algorithmic distribution. That changed.
YouTube's own Search & Discovery documentation confirms the ranking signals directly: "Our systems use both avg. view duration and avg. % viewed as signals to inform ranking. Lastly, we look at whether or not viewers enjoyed the video using likes/dislikes and post-watch survey results."
YouTube's recommendation system page adds another layer. Satisfaction surveys, where YouTube asks viewers "What did you think of this video?", now directly influence recommendations alongside traditional retention signals. YouTube's Performance FAQ puts it plainly: "The system learns how much of the video the viewer watches and if they're satisfied."
What changed practically: a shorter video where the viewer watches 100% and clicks "like" now sends a stronger signal than a 20-minute video with 40% audience retention that the viewer abandoned. YouTube CEO Neal Mohan's 2026 letter emphasized that the platform's recommendation system processes more signals than ever. CNBC's reporting on that letter highlighted YouTube's investment in recommendation quality and satisfaction measurement.
The satisfaction signals YouTube now tracks alongside audience retention:
Retention is still the foundation. But in 2026, high retention alone doesn't guarantee distribution. The algorithm rewards videos that leave viewers satisfied.
Knowing what "good" audience retention looks like prevents you from solving the wrong problem.
According to Retention Rabbit's benchmark report covering over 10,000 videos across 75+ niches:
Viewer commitment varies by how long they expect the video to be. Someone clicking a 3-minute video has different pacing expectations than someone clicking a 45-minute deep dive.
YouTube's own documentation confirms there is "no optimal length for YouTube videos." A 35% retention rate on a 30-minute video generates more total watch time (10.5 minutes) than 60% retention on a 3-minute video (1.8 minutes). The right length is whatever your content naturally supports without padding.
Audience retention varies dramatically by category, and most creators never account for this:
If you're a vlogger comparing your audience retention to an educational creator and feeling bad, stop. The niches aren't comparable. And if you're choosing what kind of channel to start, retention benchmarks by niche should factor into that decision.
TubeLab's niche finder shows which categories support longer viewing sessions, what video lengths perform best, what the competition looks like, and what CPMs advertisers pay. Checking this data before committing to a content strategy can prevent months of working against a low retention ceiling you didn't know existed.
Your audience retention graph is the most useful diagnostic tool YouTube gives creators. Most people glance at it, see a declining line, and move on. But the shape of that decline tells you exactly what went wrong and where.
In YouTube Studio, go to Content, select any video, click Analytics, then select the Engagement tab. YouTube's official documentation explains the four types of moments you'll see:
You need at least 60 seconds of video and 100 views for the data to populate. Click "See More" to compare your video against all YouTube videos of similar length. Under "Segments," you can break down audience retention by new vs returning viewers and subscribers vs non-subscribers. These breakdowns are extremely useful and most creators never check them.
Beyond YouTube's four moment types, TubeLab's Retention Cheatsheet identifies six common audience retention graph patterns. Each one tells a different story about what went wrong (or right).
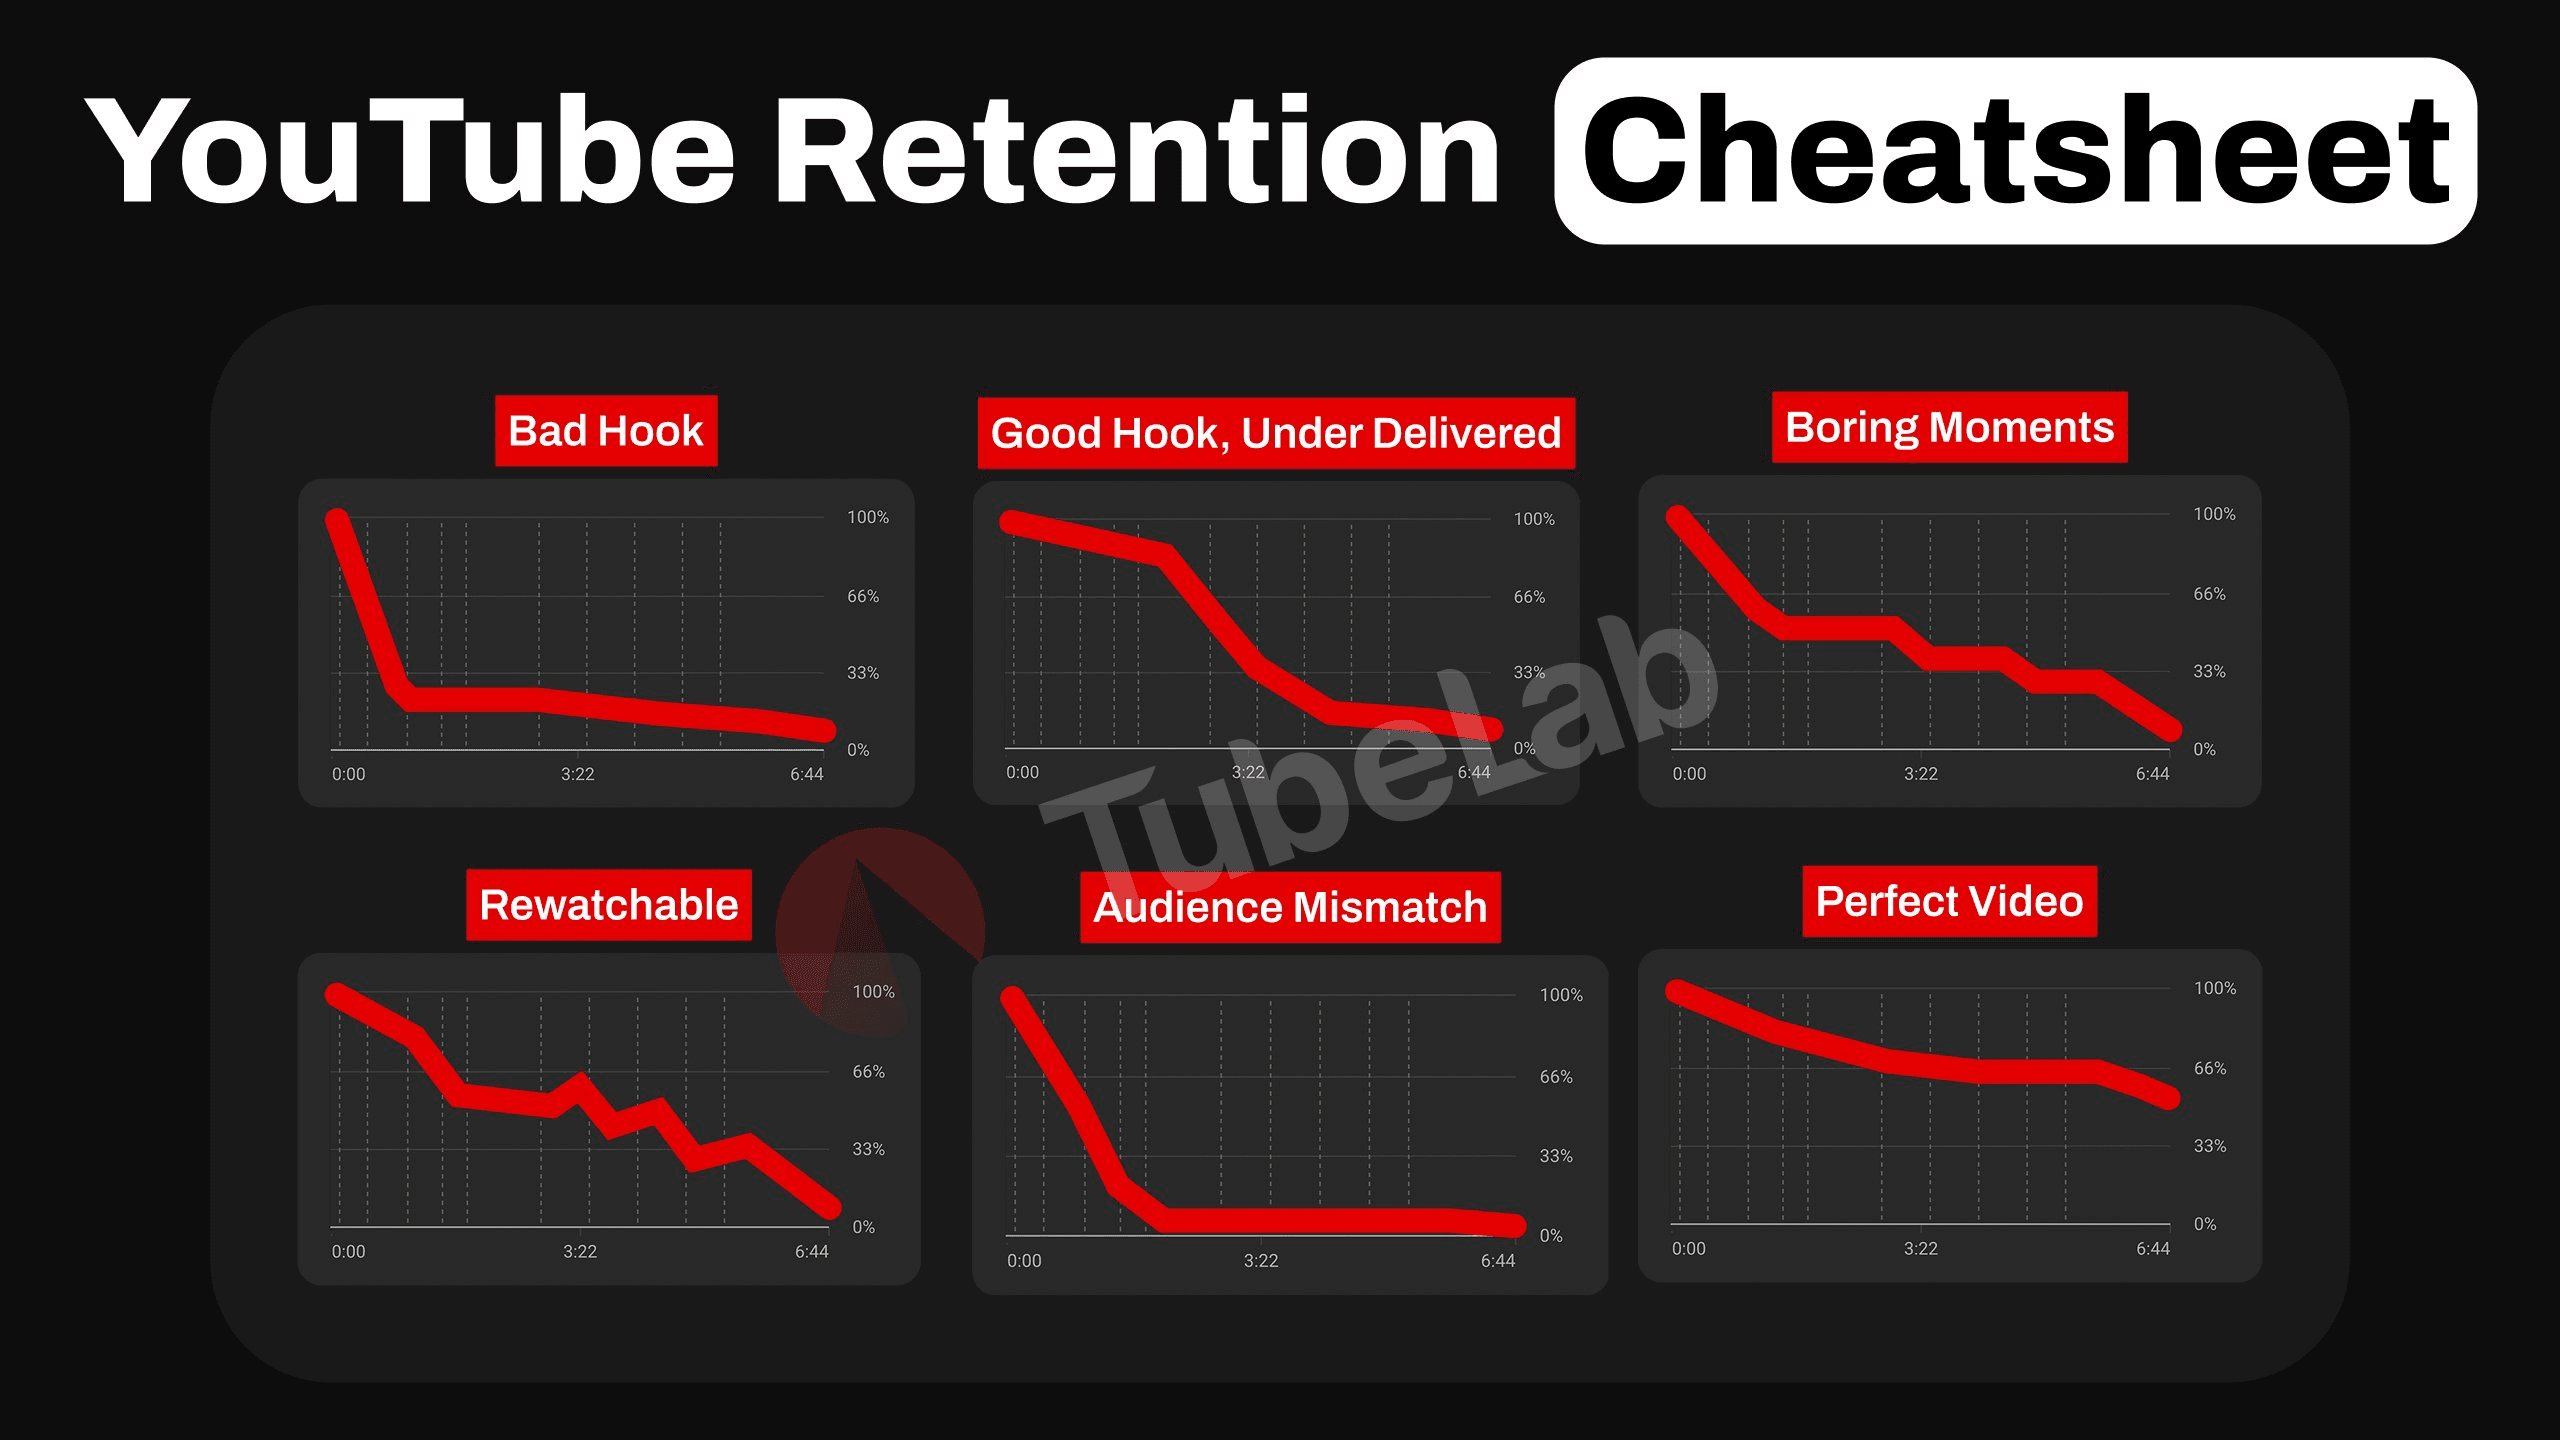
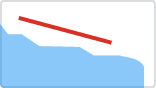
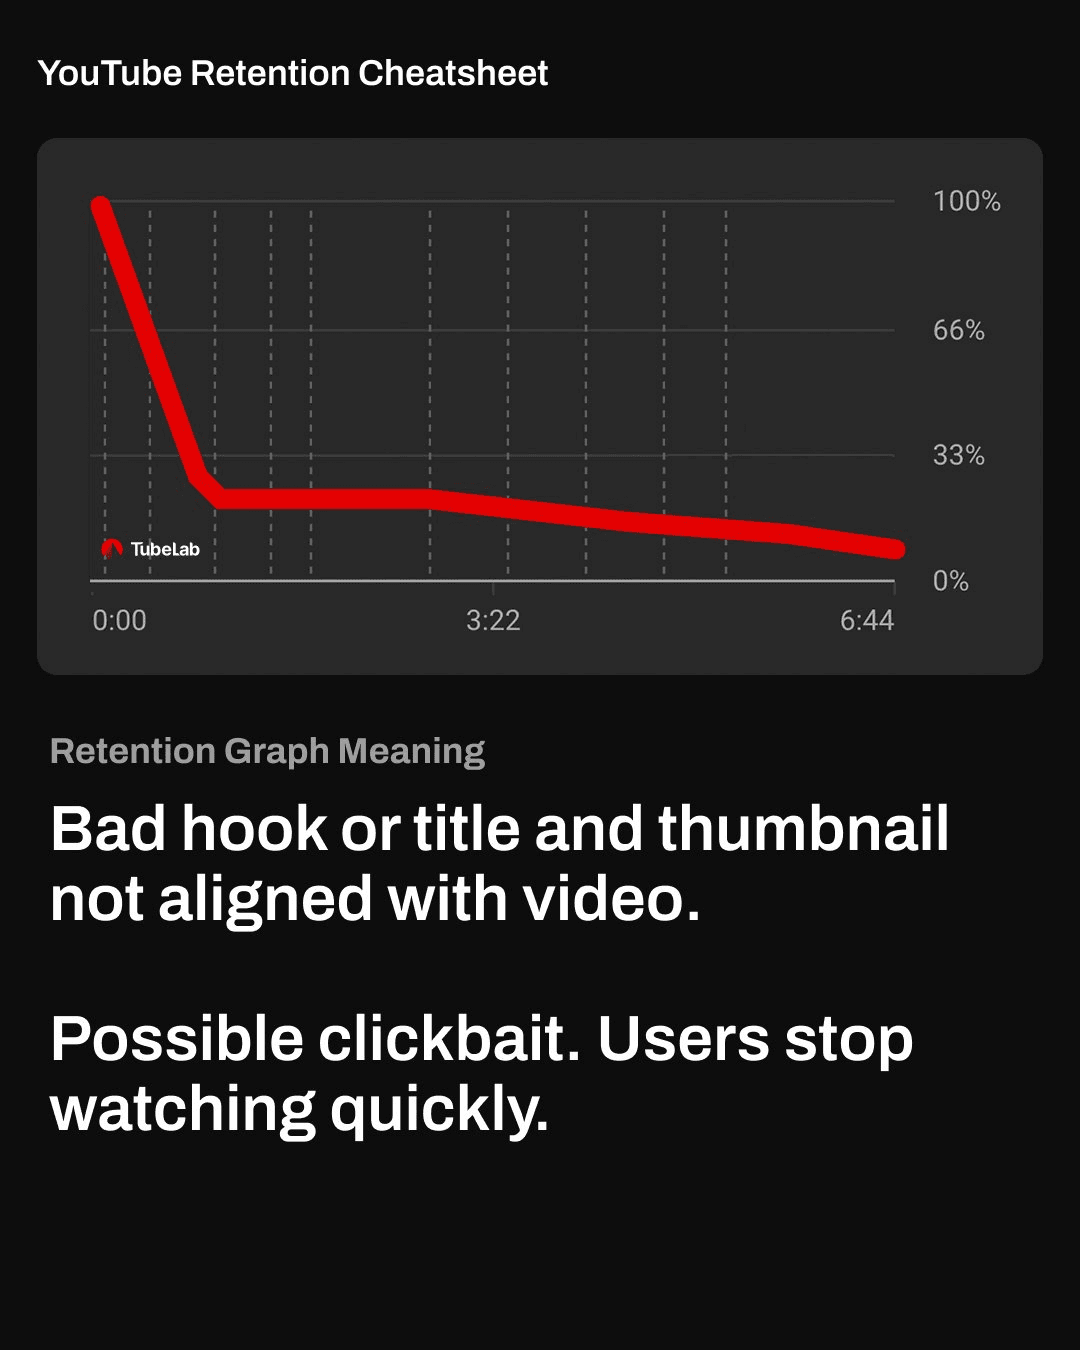
1. Bad Hook (steep cliff in first seconds). The title and thumbnail pulled viewers in. The intro pushed them out. The click promise was broken. This doesn't necessarily mean your content is bad. It means the first 5-10 seconds didn't match what the viewer expected to see when they clicked. Maybe the title promised a specific payoff but the video opened with 30 seconds of backstory. Maybe the thumbnail showed high-energy content but the intro was slow and explanatory. The fix is surgical: match the first seconds of your video to the exact reason viewers clicked. If your thumbnail promises a dramatic moment, show a taste of that moment immediately.
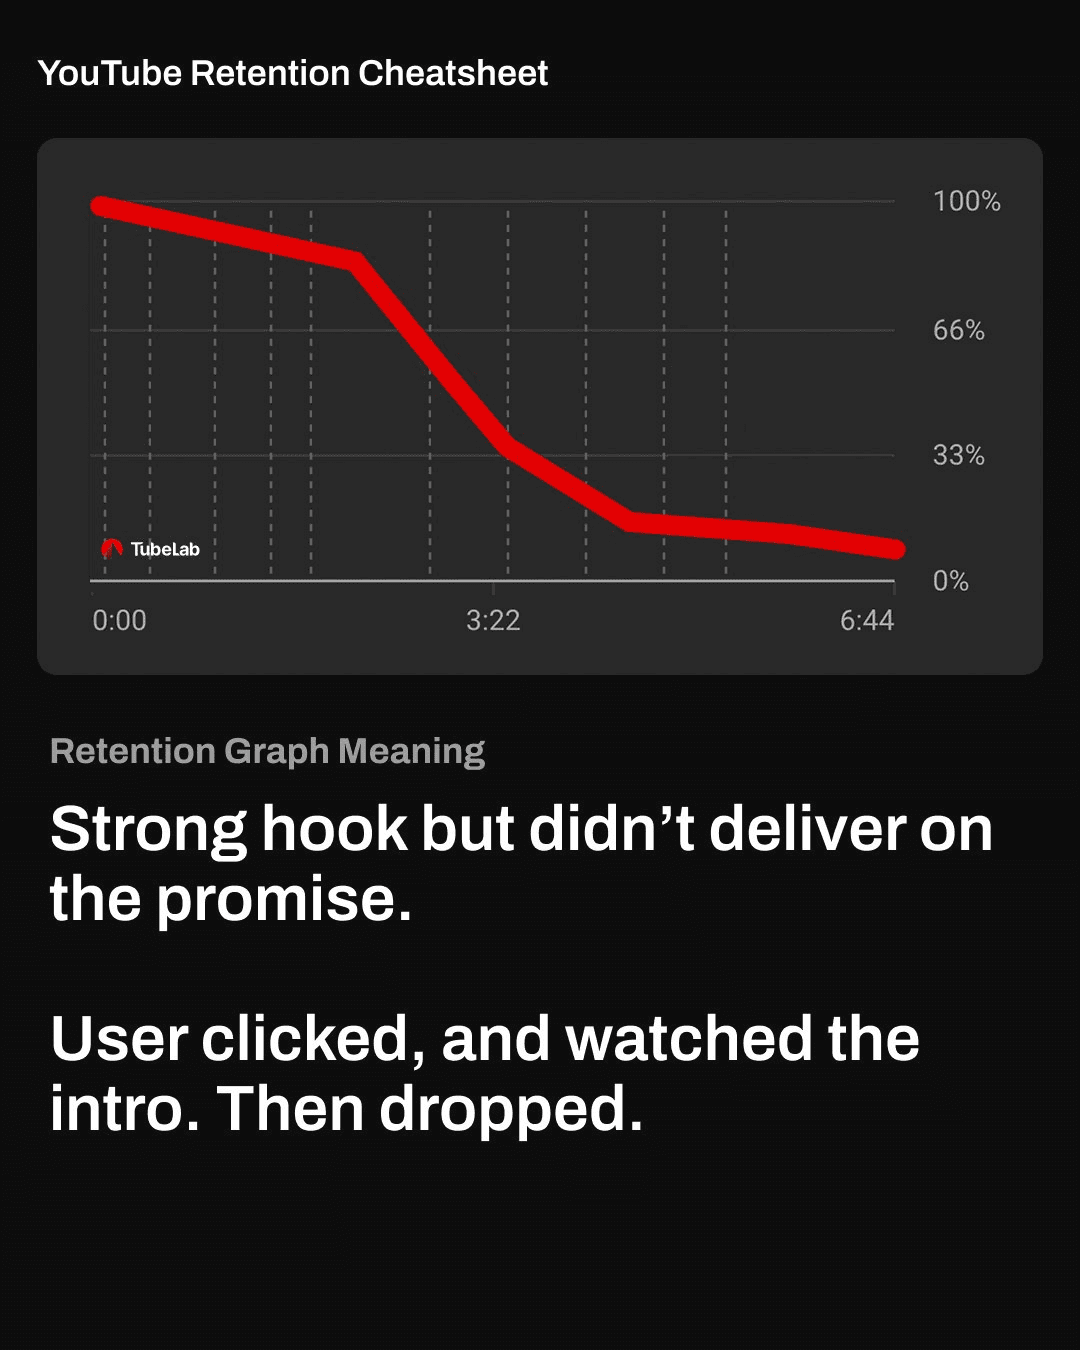
2. Good Hook, Underdelivered (strong start, then fast decline). Viewers stayed through the intro. They gave you their attention. Then the main content started and they left. The intro earned attention but the video stalled or delayed the payoff. This often happens with videos that have a 60-90 second intro building hype, followed by a slow transition into the actual content. The viewer's patience runs out during that transition. Fix: deliver value sooner. Get to the main content faster. If viewers are staying for your intro but leaving when the "real video" starts, the real video isn't matching the energy of the intro.
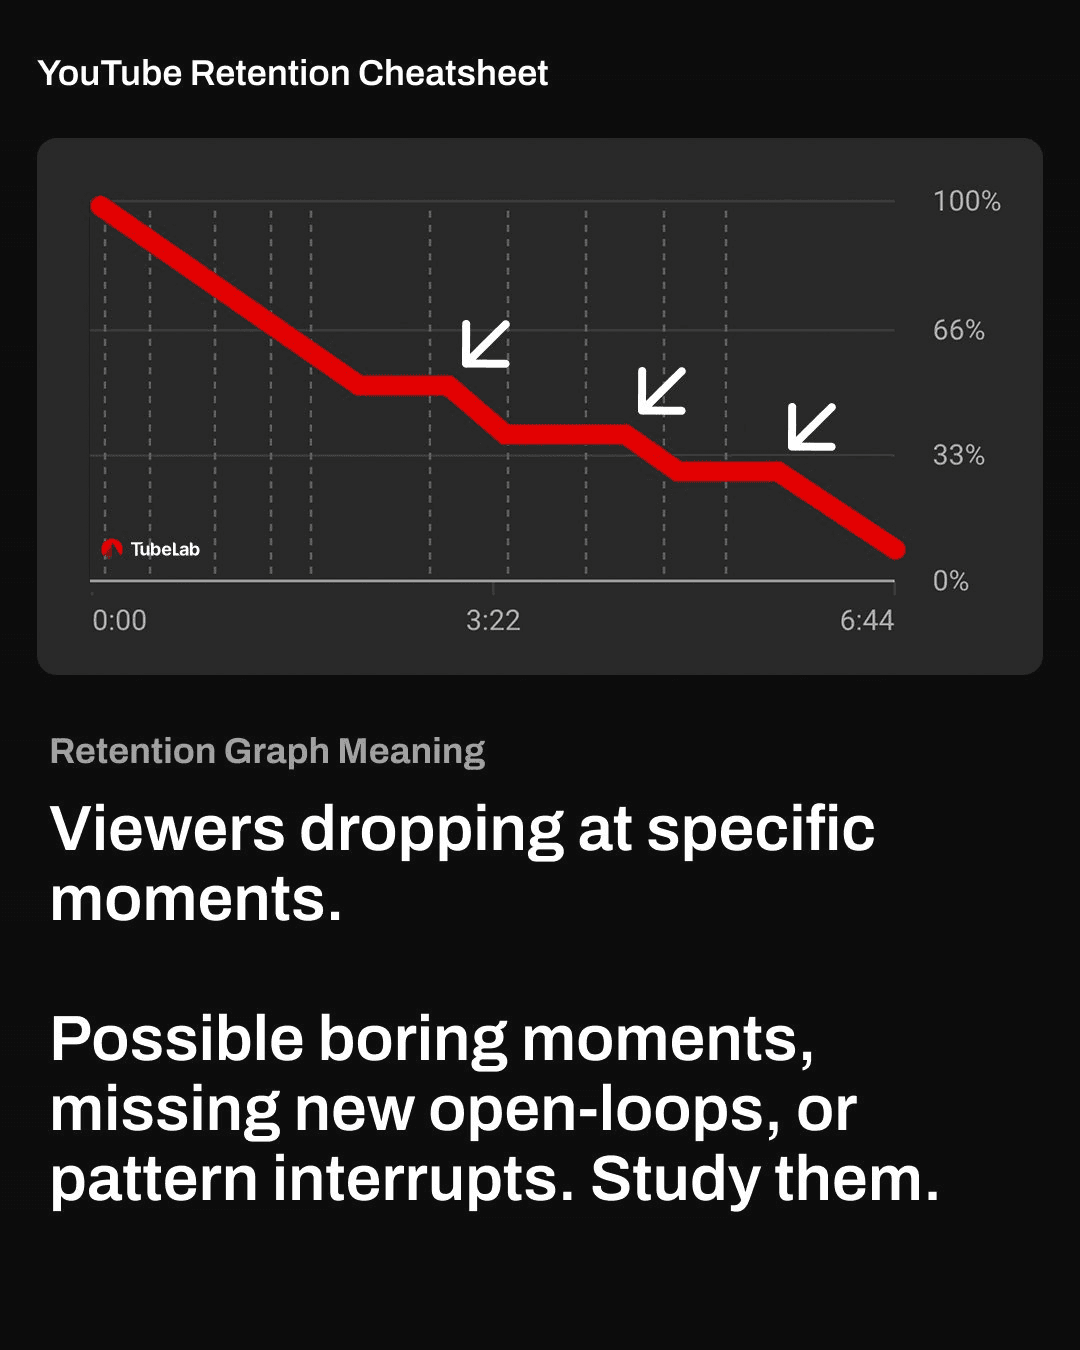
3. Boring Moments (sharp drops at specific timestamps). Unlike a smooth decline, this graph shows sudden drops at particular points. Something specific happened at those timestamps that killed engagement: a long transition, a tangent, a segment that lost energy, or a moment where the pacing stalled. Fix: go to the exact timestamp of each dip. Watch those 30 seconds. You'll almost always find a specific production choice that caused it. Cut the cause or add a pattern interrupt before it in your next video.
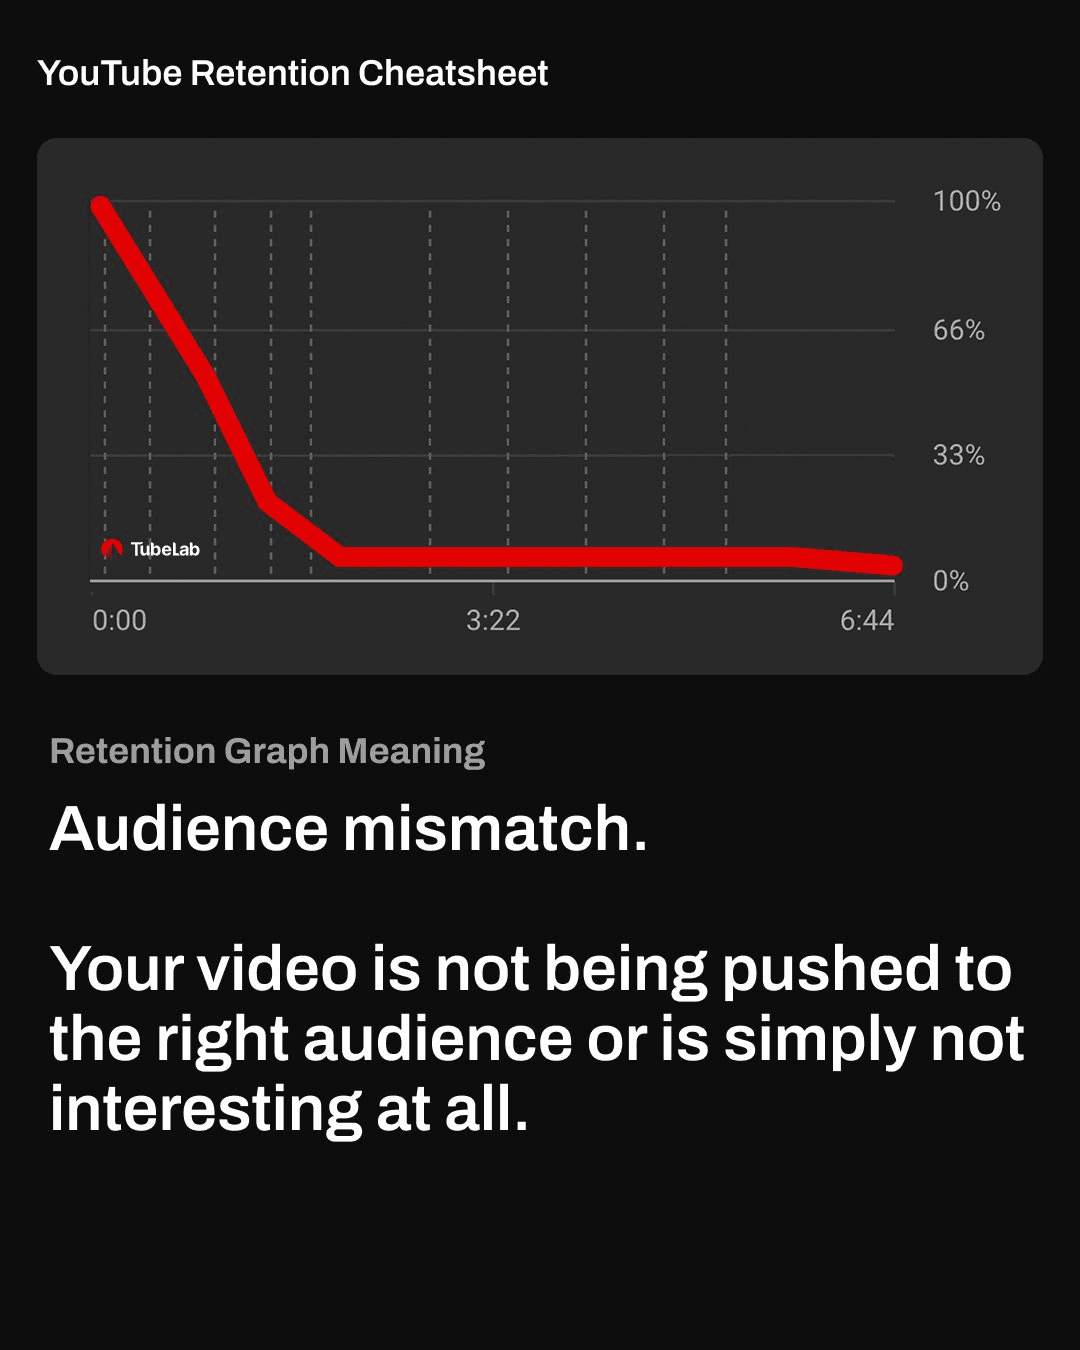
4. Audience Mismatch (instant plummet, flatline near zero). Viewers leave in the first 10-15 seconds and never come back. The video reached people who were never meant to watch it. The content isn't the problem. The targeting is. Your title and thumbnail attracted an audience that your actual content doesn't serve. Fix: tighten your niche. Make sure title, thumbnail, and content all speak to the same viewer. Note: this pattern can be completely normal for new channels while YouTube is still learning who your audience is.
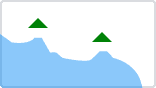
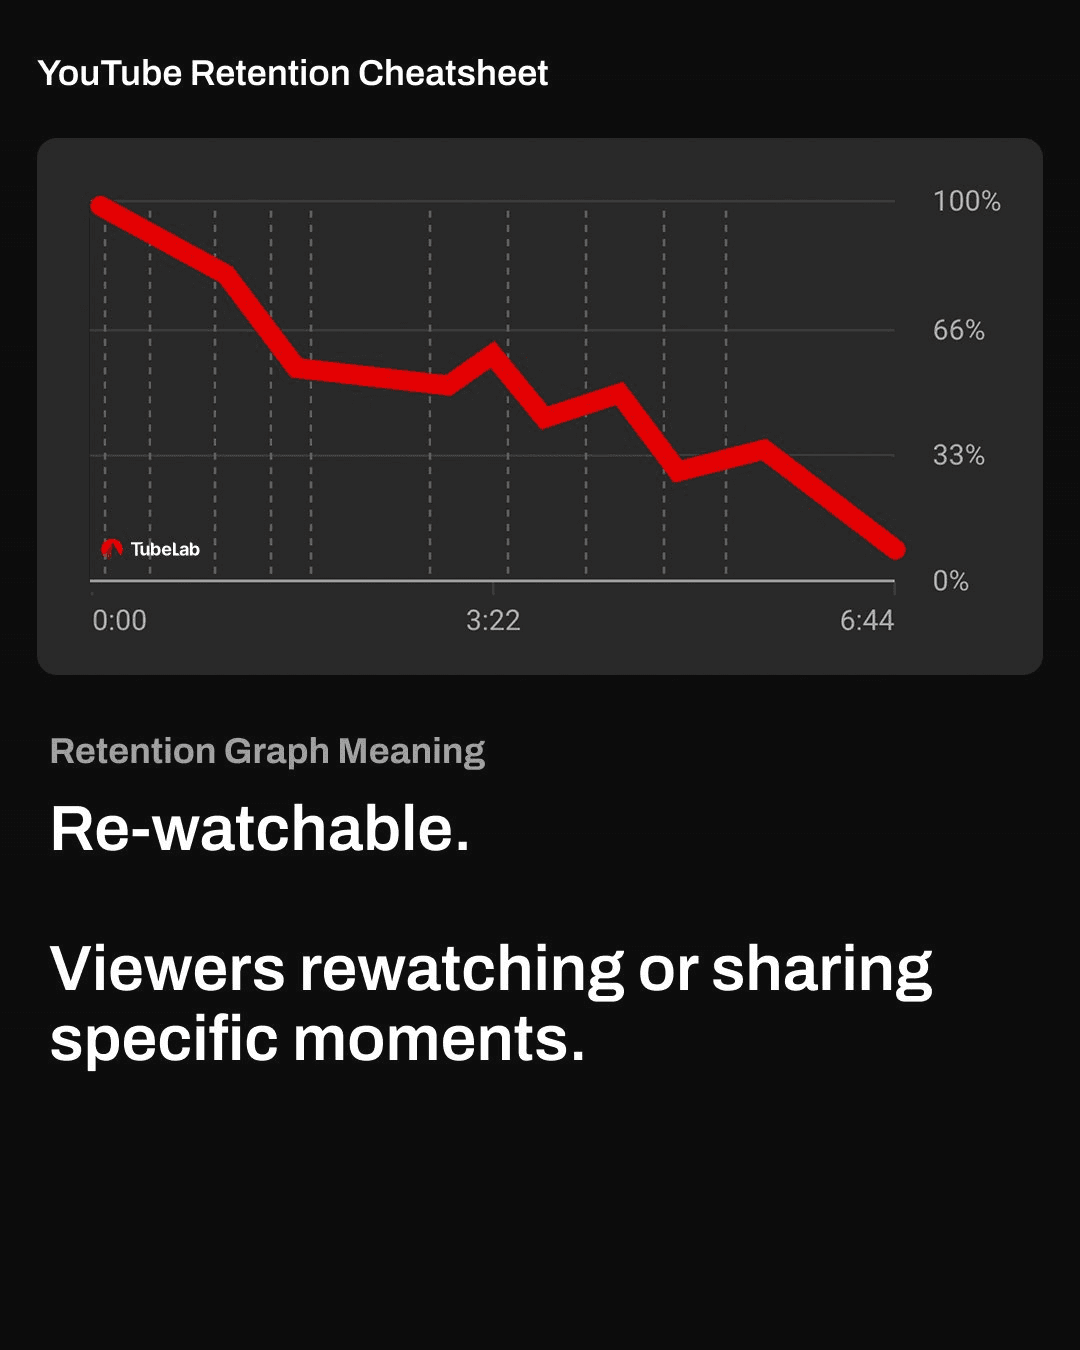
5. Rewatchable Moments (small spikes at specific points). Bumps in the retention graph where the line goes up instead of down. Viewers replayed or shared those exact moments. These spikes are gold. They tell you what your audience found most valuable. Fix: study what caused each spike. Was it a reveal? An explanation? A joke? A visual? Make more content using whatever generated those spikes. If an explanation style got rewatched, lean harder into that style.
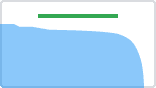
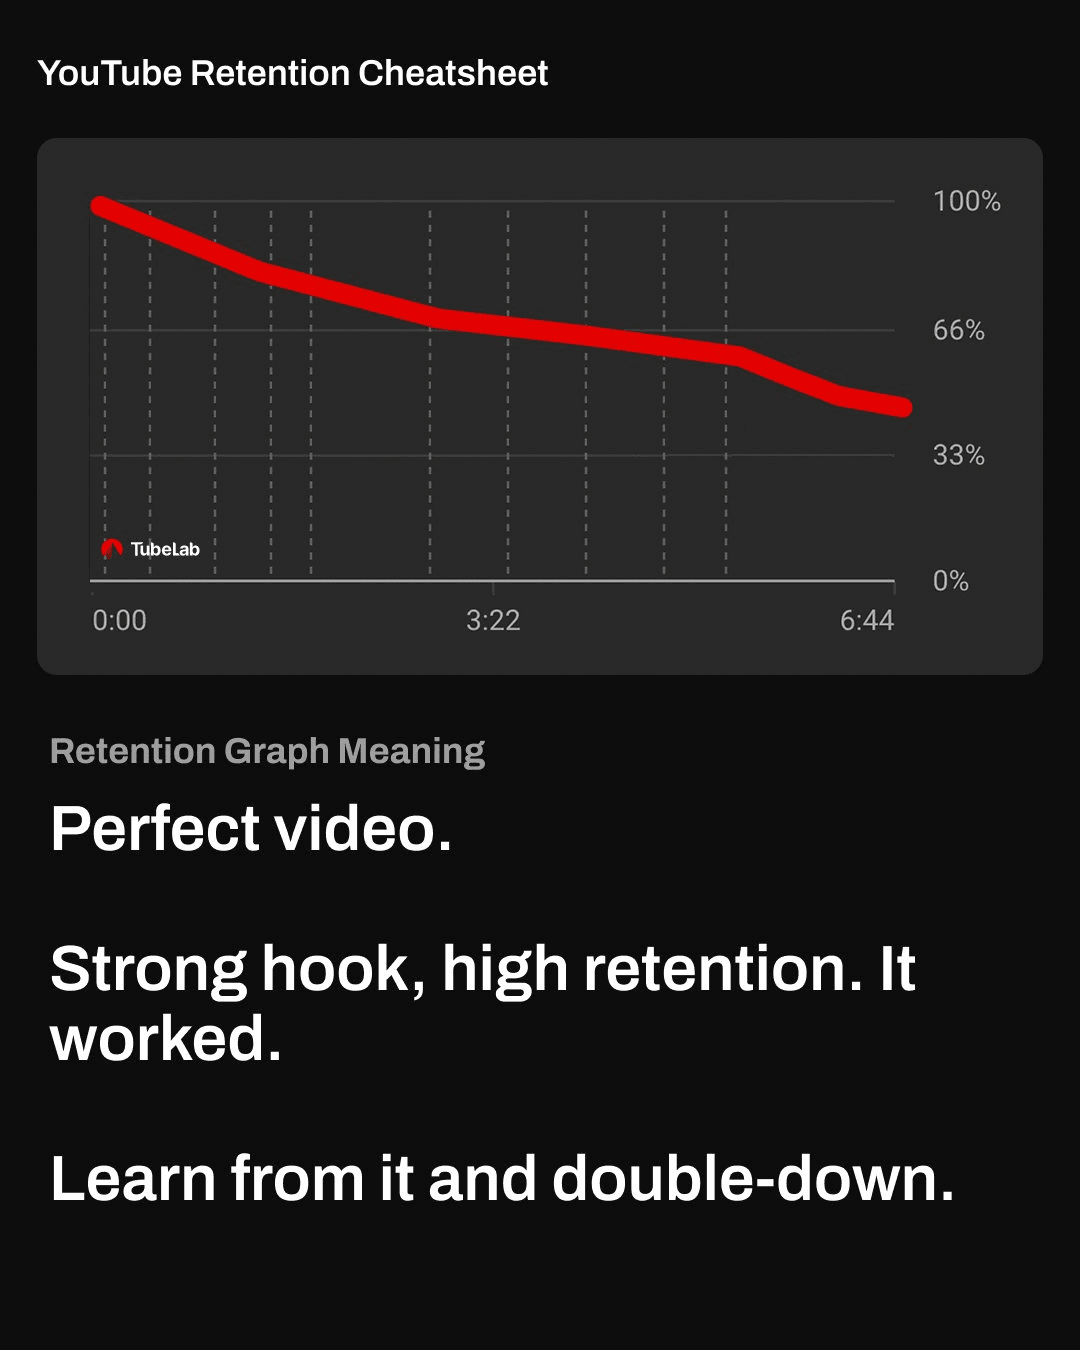
6. Perfect Video (smooth gradual decline, no sudden drops). Strong hook, consistent pacing, clear story, and the retention line stays relatively high throughout with no sudden drops. This is the graph you're aiming for. Fix: nothing. Identify what format, length, topic, and editing approach produced this result and repeat it. Use TubeLab's outlier finder to check whether videos matching this format are also outperforming across your niche. If they are, you've found your formula.
Pull up the retention graphs for your last 10 videos side by side. This is the most productive 30 minutes you can spend as a creator.
Answer these questions:
One note on reading the data: YouTube reports audience retention in 1% increments, which can round and skew results. Don't obsess over single percentage points. Look for trends across all 10 videos. The patterns that repeat are the ones worth fixing.
Every audience retention guide covers hooks, pattern interrupts, and tight intros. This section covers the factors below the surface of the iceberg: the production decisions that quietly push viewers away or pull them deeper.
These aren't quick fixes. Each one requires understanding why it affects audience retention, not just what to do.
The gap between resolving one segment and starting the next is where most retention loss happens. A segment ends, the tension drops, and for a few seconds there's nothing pulling the viewer forward. That window of zero momentum is where people leave.
Creators often fill these gaps with transition footage, a brief summary of what was covered, or a setup for the next segment. Every second spent here is a second without forward momentum, and viewers feel it immediately. Their brain asks: "Is there a reason to keep watching?" If the answer isn't instant, they're gone.
The fix is aggressive: jump from one conflict into the next with almost no gap. End one segment at a peak moment and start the next segment mid-action. If you're traveling between locations, three shots of 1-2 seconds each (the departure, the trip, the arrival) captures the journey without dragging. For non-travel content, a one-second transition effect is enough.
The psychology behind this: viewers are at their most vulnerable to leaving in the moments between segments because the tension cycle that was holding them just completed. The fastest way to retain them is to start a new tension cycle before they have time to evaluate whether to keep watching. If you see dips in your audience retention graph at regular intervals, check whether those timestamps align with your segment transitions. They almost certainly do.
Most creators know that repeating the exact same sentence is bad for pacing. What they don't realize is that saying two different things with the same underlying meaning feels like repetition to viewers too. This is called implied repetition, and it's one of the sneakiest retention killers in educational and commentary content.
Example: "This matters because viewers care about pacing. The reason pacing is so important is that audiences want to feel like the video is moving forward." Those are two different sentences. But the underlying message is identical: pacing matters because viewers want progression. To a viewer, this feels like the video stalled. Nothing new was communicated.
Implied repetition kills retention because it depends on a sense of progression. Viewers are constantly (subconsciously) evaluating whether they're learning something new or seeing something new. The moment that feeling of forward motion stops, their interest drops. And implied repetition stops forward motion without the creator even realizing it.
The self-test is simple: after writing or recording each sentence, ask "did I just communicate new information, or did I rephrase something I already said?" If you're restating with an analogy, rephrasing for clarity, or circling back to a point, cut it. Say things once and move forward. Your retention will reflect the tighter pacing immediately.
When creators study successful high-retention YouTube content, they often focus on the edit speed. Fast cuts, quick transitions, rapid-fire visuals. They conclude that faster editing equals better audience retention. This is a surface-level observation that misses the actual mechanism.
The reason fast-cut content retains well is that fast cuts are one way to deliver new information quickly. Each cut introduces a new visual, a new angle, a new piece of data. But cutting speed is just a delivery vehicle. The actual driver of audience retention is the rate of new information delivery.
Well-planned content can hold a single shot for two or three minutes without losing a viewer, as long as new information keeps flowing. Educational creators do this regularly: a single talking-head shot where every sentence introduces a new idea, a new example, or a new angle on the topic. The viewer doesn't need visual stimulation because their brain is stimulated by the information stream.
The practical takeaway: when planning pacing for audience retention, think about information rate first. Ask "how often am I giving the viewer something new?" Then use editing techniques (cuts, B-roll, graphics, zooms) to reinforce that pace. If you only focus on editing speed without an information stream backing it up, you'll create content that feels rushed but empty. That's worse for audience retention than a slow video with substance.
Speed up context-heavy moments viewers don't need to dwell on (background setup, logistics, transitions). Slow down during reveals, payoffs, and emotional peaks. This contrast between fast and slow matches the viewer's interest level at each moment. Test your pacing by playing the video at 1.25x speed. If it's still clear and easy to follow, your regular talking speed might be too slow for your audience.
This one surprises most creators, but it's backed by consistent retention data: the main character (usually the creator themselves) should get the most screen time in every video. Not equal time. The most.
YouTube content depends on the parasocial connection between creator and viewer. Returning viewers come back to see you. When the screen time balance shifts too far toward side characters, friends, or guests, that connection weakens and retention drops. People often assume that a famous guest will automatically boost retention. It rarely works that way. Unless the guest is entertaining and engaging for your specific audience, they're just a more interesting side character. The audience still came for you.
The exceptions are clear: collaboration content where both creators have established audiences, or content where the main appeal is the interaction (challenges, competitions). But even in these formats, the creator should remain the emotional anchor the viewer follows through the story.
If you have side characters, they need to be genuinely interesting. There are four qualities that make viewers care about a character: perceived importance or status, extraordinary skills or abilities, unique personality traits, or a clear purpose in the story. Side characters with negative traits that aren't balanced by one of these four qualities will actively hurt your audience retention. Some creators have improved retention by cutting certain people out of their videos entirely, choosing the video's success over personal feelings.
Always introduce new characters with a name tag or brief title. Viewers who have to figure out who someone is and why they're there are spending cognitive effort on logistics instead of being immersed in the content. That cognitive load directly reduces retention.
Creators obsess over visuals for audience retention. Almost nobody talks about sound design, even though it has a measurable effect on how long people watch.
Silence before reveals. Most creators think silence is bad for audience retention. But a brief moment of complete silence right before a major reveal creates contrast that makes the next moment hit harder. The brain expects continuous audio. When it disappears for 1-2 seconds, attention spikes. The reveal that follows lands with more impact, which improves satisfaction and audience retention.
Risers to build anticipation. A subtle audio riser (a gradually building sound) before a key moment creates a sense of "something is coming." Many creators skip this and let reveals happen flat. Even a short riser makes viewers feel like the payoff was worth waiting for, which keeps them watching through the next section.
Consistent volume throughout. Sudden jumps in music volume break immersion. Viewers who have to reach for their volume slider are no longer passively absorbed in your content. They're managing a device. That momentary break in immersion makes them more likely to evaluate whether they want to keep watching. Keep audio levels smooth. Let viewers forget they're choosing to watch.
Music choice signals pacing. Viewers subconsciously read the music as a pacing signal. If the music builds tension, they expect something to happen. If the music relaxes, they expect a breather. Mismatches between music pacing and content pacing confuse viewers and reduce audience retention. When you want viewers to feel urgency, the music should build. When you deliver a payoff, the music should resolve. This alignment keeps the emotional experience coherent.
In educational content, how seriously viewers take your expertise directly affects how long they're willing to watch. A finance creator who doesn't appear financially successful will struggle to hold retention because viewers question why they should spend time on advice from someone who doesn't seem to live it.
This isn't about faking credentials. It's about understanding that viewers make a rapid judgment in the first 30 seconds about whether you're worth listening to. Specialized language used sparingly (with text boxes defining terms for non-experts) signals expertise and separates you from creators who only cover topics at the surface level. The balance is important: too much jargon becomes a barrier, but zero specialized language makes you seem like you're repeating what you read elsewhere.
For any educational content, the perceived authority question is: "Does this person seem like they actually know more than me?" If the answer feels like no, the viewer leaves. If the answer feels like yes, they'll tolerate slower pacing, longer videos, and less polished production because they believe the information is worth their time. That belief is directly reflected in your retention curve.
Every video has moments that are slower than others. Context needs to be delivered. Transitions need to happen. Not every second can be a peak moment. The question is: how do you retain viewers through those necessary slower sections?
The answer is unpredictability. When viewers have already seen one or two unexpected moments earlier in a video, they develop an expectation that something surprising could happen at any time. That anticipation carries them through sections that would otherwise lose their attention. They stay because leaving means potentially missing the next unexpected moment.
This works because the brain is wired to pay attention when outcomes are uncertain. Predictable content lets the brain relax and disengage. Unpredictable content keeps it alert. You can plan for unpredictable moments. They don't need to be genuinely unplanned. Things going "wrong," unscripted reactions, detours from the expected path, or elements the viewer didn't anticipate from your typical format all create the feeling that anything could happen. That feeling is one of the most powerful retention tools you have.
The key constraint: unexpected moments need to serve the story. If they feel random or disconnected from the video's goal, they confuse viewers instead of engaging them. The best unpredictable moments either add an obstacle to the goal, create a new piece of tension, or deliver an unexpected payoff. As long as they move the story forward, they make the whole video feel more alive.
Everything above this section is about fixing audience retention problems. This section is about preventing them before you create.
The audience retention strategies that work for a 20-minute true crime documentary don't apply to a 5-minute cooking tutorial. Applying the wrong tactics to the wrong content type wastes effort. Before optimizing, you need to know what actually holds attention in your specific category.
Every niche has videos that dramatically outperformed their channel's average. These outliers didn't just get more clicks. They held viewers longer, which is why the algorithm pushed them further.
Find outliers manually: sort competitor channels by "Most Popular" and study what those top videos have in common. Look at their length, intro style, pacing, editing approach, and format. Pay attention to what format dominates the top performers. That format is what your niche's audience prefers for sustained viewing.
For research at scale, TubeLab's outlier finder searches millions of verified videos filtered by:
If the same format, topic angle, and duration keep appearing in the outlier data, that's a strong signal about what retains viewers in your niche. Finding this pattern before creating saves months of guessing.
Before filming, cross-reference your research:
Check the niche. TubeLab's niche finder shows saturation, CPM estimates, growth trends, top-performing channels, and ideal video lengths for any YouTube category.
Check competitors. The free TubeLab Chrome Extension shows monetization status, RPM estimates, and video performance data on any channel while you browse YouTube.
Check outliers. TubeLab's outlier finder reveals which topics, formats, and durations are outperforming in your category right now.
Check title alignment. TubeLab's title formula tool analyzes millions of viral titles to surface character counts, emotional triggers, and structural patterns by niche. Titles that set accurate expectations lead to better audience retention because viewers get what they clicked for.
This research takes 30 minutes. It can save months of creating content in a format your audience won't watch long enough to build retention.
What is a good YouTube audience retention rate? It depends on video length. For videos under 5 minutes, 50-70% retention is healthy. For 5-10 minutes, 40-55%. For 10-20 minutes, 35-45%. For 20+ minutes, 25-35%. The platform average is just 23.7%, so anything above 30% puts you ahead of most creators. Educational content has the highest average retention at 42.1%. Vlogs sit lowest at 21.5%.
How does YouTube audience retention affect the algorithm in 2026? Audience retention is the primary quality signal, but in 2025-2026 YouTube added satisfaction signals on top: post-watch surveys, repeat viewing, session continuation, shares, and comment sentiment. High retention still matters, but videos that leave viewers feeling satisfied get additional distribution. Channels improving audience retention by 10 points see 25%+ more impressions.
Where do I find my YouTube audience retention data? YouTube Studio: Content > select a video > Analytics > Engagement tab. The audience retention graph shows where viewers stayed, left, rewatched, or skipped. You need at least 60 seconds of video and 100 views. Click "See More" to compare against similar-length videos and view breakdowns by new vs returning viewers and subscribers vs non-subscribers.
Does YouTube audience retention affect monetization? Indirectly, yes. Higher retention leads to more algorithmic distribution, more views, and more watch time. YouTube monetization requires 4,000 hours of watch time in 12 months. Better retention reaches that threshold faster. Once monetized, higher retention means viewers see more ads and generate more revenue per video.
What's the most common cause of low YouTube audience retention? The first 30 seconds. 55% of viewers leave within the first minute. If your intro doesn't confirm the click promise, retention drops immediately. After the intro, the most common killer is segmentation loss: long transitions between segments where the story loses momentum and viewers lose interest.
Should I make shorter videos to improve audience retention? Not necessarily. A tight 8-minute video with 50% audience retention generates more total watch time per viewer than a 3-minute video with 70% audience retention. YouTube's own docs confirm there's no optimal video length. Make videos as long as the content supports. Cut ruthlessly so every minute earns its place.
How can pattern interrupts improve YouTube audience retention? Pattern interrupts (visual or audio changes) reset attention every 60-90 seconds. A camera angle cut, B-roll clip, graphic overlay, or zoom cut prevents viewers from drifting into passive mode. 55% of viewers leave in the first minute of any video. Pattern interrupts reduce that drop. But they alone don't fix retention. They prevent attention decay while your content, pacing, and storytelling do the actual retention work.
How do I find what video format retains best in my niche? Study outlier videos. Sort competitor channels by "Most Popular" and note which videos dramatically outperformed. Look at format, length, and editing style. For research across hundreds of channels, TubeLab's outlier finder searches millions of videos filtered by niche, performance multiplier, and duration to reveal high-retention formats.
Does YouTube audience retention differ for Shorts? Yes. Shorts have higher audience retention standards because they're shorter. Aim for 70%+ as a baseline. Since March 2025, YouTube counts "engaged views" (where the viewer actively chose to watch) as the primary metric. Shorts that loop, achieving over 100% average view duration, signal extremely high satisfaction and receive more distribution.
Can I improve audience retention on already-published videos? You can't edit content without re-uploading (which resets metrics). But you can update thumbnails and titles to attract a better-matched audience, which improves retention on future views. YouTube's recommendation documentation confirms that changing titles/thumbnails affects viewer interaction, which the system responds to. Study your audience retention data from existing videos and apply those lessons to your next upload.
YouTube Help - Measure Key Moments for Audience Retention - Official documentation on the four types of audience retention graph moments (flat lines, gradual declines, spikes, dips), how to view audience retention by segment type, and metric definitions for average view duration and watch time.
YouTube Help - Search & Discovery Tips for Creators - YouTube's official confirmation that "our systems use both avg. view duration and avg. % viewed as signals to inform ranking" and that post-watch survey results factor into ranking alongside audience retention.
YouTube Help - How YouTube Recommendations Work - Official explanation of recommendation signals including watch history, satisfaction surveys, likes, dislikes, and "not interested" feedback.
YouTube Help - Discovery and Performance FAQs - YouTube's official statement: "The system learns how much of the video the viewer watches and if they're satisfied."
YouTube Help - Good to Know About Recommendations - Official documentation confirming no optimal video length and that changing titles/thumbnails affects performance through viewer behavior, not algorithmic penalty.
YouTube Blog - Neal Mohan's 2026 Letter: The Future of YouTube - YouTube CEO's 2026 priorities including 200B daily Shorts views, platform investment in recommendation quality, and the creator economy's growth.
CNBC - YouTube Chief Says 'Managing AI Slop' Is a Priority for 2026 - Reporting on Neal Mohan's annual letter and YouTube's investment in recommendation quality.
Retention Rabbit - 2025 YouTube Audience Retention Benchmark Report - Third-party benchmark data covering 10,000+ videos across 75+ niches: 23.7% average audience retention, 55% first-minute drop-off, audience retention by niche and video length.
TubeLab - YouTube Retention Cheatsheet - Visual guide to the six common audience retention graph shapes and diagnostic approach for each pattern.
Audience retention improves when you stop guessing and start studying what works. Learn to read your retention graphs. Fix the specific moments where viewers drop off. And before creating new content, research what formats, topics, and video lengths hold attention in your niche.
The TubeLab Chrome Extension is free and requires no account. Install it to check any competitor's video performance, monetization status, and RPM estimates while browsing YouTube. Understanding what works in your niche starts with seeing the data on every video you watch.
For deeper research, the full TubeLab platform ($178.80/year) includes the outlier finder across millions of verified videos, the niche finder with saturation metrics and CPM data, title formula analysis, channel search across 400K+ channels, and API access for custom workflows and n8n automation. No tiers, no feature gating, no upsells. The deepest annual discount in the category at 49% off monthly pricing.
Every YouTube growth guide mentions audience retention. Almost none of them go deep enough to actually fix it.
Search "how to improve YouTube audience retention" and you'll find the same advice recycled across hundreds of articles: hook viewers in the first 30 seconds, use pattern interrupts, check your retention graph. That covers maybe 10% of what actually determines how long people watch your videos. The other 90% lives in production decisions that most creators never think about, and that most guides never mention.
Think of audience retention like an iceberg. The tip above the waterline is what everyone talks about: your intro, your hook, your content selection, whether you add B-roll and graphics. Below the surface sit less obvious factors: how your pacing matches your audience type, whether your voiceover matches the visuals on screen, how long your transitions last between segments, what your music choice signals to the viewer. And at the very bottom sit the things almost nobody talks about: how your side characters affect whether people keep watching, whether you remind viewers what's at stake often enough, how your perceived authority shapes willingness to sit through your advice, and why unpredictable moments generate curiosity that carries retention through slower sections.
Most creators only fix the tip. Then they wonder why their retention barely moves.
YouTube audience retention is the percentage of your video that viewers watch before leaving. A 10-minute video with 40% audience retention means viewers watched about 4 minutes on average. And in 2025-2026, YouTube made retention matter even more. The algorithm shifted to what multiple sources call satisfaction-weighted discovery: retention now combines with post-watch surveys, repeat viewing behavior, and session signals to determine which videos get recommended.
Before creating content, check what's already holding attention in your niche. The TubeLab Chrome Extension is free and shows competitor video performance, monetization status, and estimated RPM with one click. If top creators in your niche hold viewers for 8+ minutes on 12-minute videos, the audience is willing to watch long content. If nobody holds attention past 3 minutes, the niche itself might have an audience retention ceiling you should know about before investing months of work.
This guide doesn't repeat the basics. It covers what YouTube audience retention actually measures, current benchmarks, how to read your retention graph as a diagnostic tool, and then goes deep on the production decisions below the surface of the iceberg that actually move the needle.
Understanding the metric matters because most creators confuse what YouTube tracks with what YouTube rewards.
Average view duration (AVD) is total watch time divided by total views. If 1,000 people watch your 10-minute video and the total watch time is 4,000 minutes, your AVD is 4 minutes.
Audience retention percentage is AVD as a fraction of video length. That 4-minute AVD on a 10-minute video equals 40% audience retention.
Here's where creators get confused: a 35% retention rate on a 30-minute video represents 10.5 minutes of watch time per viewer. A 60% audience retention rate on a 3-minute video represents 1.8 minutes. The shorter video has better audience retention percentage but dramatically less raw watch time. YouTube's algorithm considers both signals. Don't compare audience retention across different video lengths. Compare within similar ranges.
Audience retention alone used to be enough to trigger algorithmic distribution. That changed.
YouTube's own Search & Discovery documentation confirms the ranking signals directly: "Our systems use both avg. view duration and avg. % viewed as signals to inform ranking. Lastly, we look at whether or not viewers enjoyed the video using likes/dislikes and post-watch survey results."
YouTube's recommendation system page adds another layer. Satisfaction surveys, where YouTube asks viewers "What did you think of this video?", now directly influence recommendations alongside traditional retention signals. YouTube's Performance FAQ puts it plainly: "The system learns how much of the video the viewer watches and if they're satisfied."
What changed practically: a shorter video where the viewer watches 100% and clicks "like" now sends a stronger signal than a 20-minute video with 40% audience retention that the viewer abandoned. YouTube CEO Neal Mohan's 2026 letter emphasized that the platform's recommendation system processes more signals than ever. CNBC's reporting on that letter highlighted YouTube's investment in recommendation quality and satisfaction measurement.
The satisfaction signals YouTube now tracks alongside audience retention:
Retention is still the foundation. But in 2026, high retention alone doesn't guarantee distribution. The algorithm rewards videos that leave viewers satisfied.
Knowing what "good" audience retention looks like prevents you from solving the wrong problem.
According to Retention Rabbit's benchmark report covering over 10,000 videos across 75+ niches:
Viewer commitment varies by how long they expect the video to be. Someone clicking a 3-minute video has different pacing expectations than someone clicking a 45-minute deep dive.
YouTube's own documentation confirms there is "no optimal length for YouTube videos." A 35% retention rate on a 30-minute video generates more total watch time (10.5 minutes) than 60% retention on a 3-minute video (1.8 minutes). The right length is whatever your content naturally supports without padding.
Audience retention varies dramatically by category, and most creators never account for this:
If you're a vlogger comparing your audience retention to an educational creator and feeling bad, stop. The niches aren't comparable. And if you're choosing what kind of channel to start, retention benchmarks by niche should factor into that decision.
TubeLab's niche finder shows which categories support longer viewing sessions, what video lengths perform best, what the competition looks like, and what CPMs advertisers pay. Checking this data before committing to a content strategy can prevent months of working against a low retention ceiling you didn't know existed.
Your audience retention graph is the most useful diagnostic tool YouTube gives creators. Most people glance at it, see a declining line, and move on. But the shape of that decline tells you exactly what went wrong and where.
In YouTube Studio, go to Content, select any video, click Analytics, then select the Engagement tab. YouTube's official documentation explains the four types of moments you'll see:
You need at least 60 seconds of video and 100 views for the data to populate. Click "See More" to compare your video against all YouTube videos of similar length. Under "Segments," you can break down audience retention by new vs returning viewers and subscribers vs non-subscribers. These breakdowns are extremely useful and most creators never check them.
Beyond YouTube's four moment types, TubeLab's Retention Cheatsheet identifies six common audience retention graph patterns. Each one tells a different story about what went wrong (or right).
1. Bad Hook (steep cliff in first seconds). The title and thumbnail pulled viewers in. The intro pushed them out. The click promise was broken. This doesn't necessarily mean your content is bad. It means the first 5-10 seconds didn't match what the viewer expected to see when they clicked. Maybe the title promised a specific payoff but the video opened with 30 seconds of backstory. Maybe the thumbnail showed high-energy content but the intro was slow and explanatory. The fix is surgical: match the first seconds of your video to the exact reason viewers clicked. If your thumbnail promises a dramatic moment, show a taste of that moment immediately.
2. Good Hook, Underdelivered (strong start, then fast decline). Viewers stayed through the intro. They gave you their attention. Then the main content started and they left. The intro earned attention but the video stalled or delayed the payoff. This often happens with videos that have a 60-90 second intro building hype, followed by a slow transition into the actual content. The viewer's patience runs out during that transition. Fix: deliver value sooner. Get to the main content faster. If viewers are staying for your intro but leaving when the "real video" starts, the real video isn't matching the energy of the intro.
3. Boring Moments (sharp drops at specific timestamps). Unlike a smooth decline, this graph shows sudden drops at particular points. Something specific happened at those timestamps that killed engagement: a long transition, a tangent, a segment that lost energy, or a moment where the pacing stalled. Fix: go to the exact timestamp of each dip. Watch those 30 seconds. You'll almost always find a specific production choice that caused it. Cut the cause or add a pattern interrupt before it in your next video.
4. Audience Mismatch (instant plummet, flatline near zero). Viewers leave in the first 10-15 seconds and never come back. The video reached people who were never meant to watch it. The content isn't the problem. The targeting is. Your title and thumbnail attracted an audience that your actual content doesn't serve. Fix: tighten your niche. Make sure title, thumbnail, and content all speak to the same viewer. Note: this pattern can be completely normal for new channels while YouTube is still learning who your audience is.
5. Rewatchable Moments (small spikes at specific points). Bumps in the retention graph where the line goes up instead of down. Viewers replayed or shared those exact moments. These spikes are gold. They tell you what your audience found most valuable. Fix: study what caused each spike. Was it a reveal? An explanation? A joke? A visual? Make more content using whatever generated those spikes. If an explanation style got rewatched, lean harder into that style.
6. Perfect Video (smooth gradual decline, no sudden drops). Strong hook, consistent pacing, clear story, and the retention line stays relatively high throughout with no sudden drops. This is the graph you're aiming for. Fix: nothing. Identify what format, length, topic, and editing approach produced this result and repeat it. Use TubeLab's outlier finder to check whether videos matching this format are also outperforming across your niche. If they are, you've found your formula.
Pull up the retention graphs for your last 10 videos side by side. This is the most productive 30 minutes you can spend as a creator.
Answer these questions:
One note on reading the data: YouTube reports audience retention in 1% increments, which can round and skew results. Don't obsess over single percentage points. Look for trends across all 10 videos. The patterns that repeat are the ones worth fixing.
Every audience retention guide covers hooks, pattern interrupts, and tight intros. This section covers the factors below the surface of the iceberg: the production decisions that quietly push viewers away or pull them deeper.
These aren't quick fixes. Each one requires understanding why it affects audience retention, not just what to do.
The gap between resolving one segment and starting the next is where most retention loss happens. A segment ends, the tension drops, and for a few seconds there's nothing pulling the viewer forward. That window of zero momentum is where people leave.
Creators often fill these gaps with transition footage, a brief summary of what was covered, or a setup for the next segment. Every second spent here is a second without forward momentum, and viewers feel it immediately. Their brain asks: "Is there a reason to keep watching?" If the answer isn't instant, they're gone.
The fix is aggressive: jump from one conflict into the next with almost no gap. End one segment at a peak moment and start the next segment mid-action. If you're traveling between locations, three shots of 1-2 seconds each (the departure, the trip, the arrival) captures the journey without dragging. For non-travel content, a one-second transition effect is enough.
The psychology behind this: viewers are at their most vulnerable to leaving in the moments between segments because the tension cycle that was holding them just completed. The fastest way to retain them is to start a new tension cycle before they have time to evaluate whether to keep watching. If you see dips in your audience retention graph at regular intervals, check whether those timestamps align with your segment transitions. They almost certainly do.
Most creators know that repeating the exact same sentence is bad for pacing. What they don't realize is that saying two different things with the same underlying meaning feels like repetition to viewers too. This is called implied repetition, and it's one of the sneakiest retention killers in educational and commentary content.
Example: "This matters because viewers care about pacing. The reason pacing is so important is that audiences want to feel like the video is moving forward." Those are two different sentences. But the underlying message is identical: pacing matters because viewers want progression. To a viewer, this feels like the video stalled. Nothing new was communicated.
Implied repetition kills retention because it depends on a sense of progression. Viewers are constantly (subconsciously) evaluating whether they're learning something new or seeing something new. The moment that feeling of forward motion stops, their interest drops. And implied repetition stops forward motion without the creator even realizing it.
The self-test is simple: after writing or recording each sentence, ask "did I just communicate new information, or did I rephrase something I already said?" If you're restating with an analogy, rephrasing for clarity, or circling back to a point, cut it. Say things once and move forward. Your retention will reflect the tighter pacing immediately.
When creators study successful high-retention YouTube content, they often focus on the edit speed. Fast cuts, quick transitions, rapid-fire visuals. They conclude that faster editing equals better audience retention. This is a surface-level observation that misses the actual mechanism.
The reason fast-cut content retains well is that fast cuts are one way to deliver new information quickly. Each cut introduces a new visual, a new angle, a new piece of data. But cutting speed is just a delivery vehicle. The actual driver of audience retention is the rate of new information delivery.
Well-planned content can hold a single shot for two or three minutes without losing a viewer, as long as new information keeps flowing. Educational creators do this regularly: a single talking-head shot where every sentence introduces a new idea, a new example, or a new angle on the topic. The viewer doesn't need visual stimulation because their brain is stimulated by the information stream.
The practical takeaway: when planning pacing for audience retention, think about information rate first. Ask "how often am I giving the viewer something new?" Then use editing techniques (cuts, B-roll, graphics, zooms) to reinforce that pace. If you only focus on editing speed without an information stream backing it up, you'll create content that feels rushed but empty. That's worse for audience retention than a slow video with substance.
Speed up context-heavy moments viewers don't need to dwell on (background setup, logistics, transitions). Slow down during reveals, payoffs, and emotional peaks. This contrast between fast and slow matches the viewer's interest level at each moment. Test your pacing by playing the video at 1.25x speed. If it's still clear and easy to follow, your regular talking speed might be too slow for your audience.
This one surprises most creators, but it's backed by consistent retention data: the main character (usually the creator themselves) should get the most screen time in every video. Not equal time. The most.
YouTube content depends on the parasocial connection between creator and viewer. Returning viewers come back to see you. When the screen time balance shifts too far toward side characters, friends, or guests, that connection weakens and retention drops. People often assume that a famous guest will automatically boost retention. It rarely works that way. Unless the guest is entertaining and engaging for your specific audience, they're just a more interesting side character. The audience still came for you.
The exceptions are clear: collaboration content where both creators have established audiences, or content where the main appeal is the interaction (challenges, competitions). But even in these formats, the creator should remain the emotional anchor the viewer follows through the story.
If you have side characters, they need to be genuinely interesting. There are four qualities that make viewers care about a character: perceived importance or status, extraordinary skills or abilities, unique personality traits, or a clear purpose in the story. Side characters with negative traits that aren't balanced by one of these four qualities will actively hurt your audience retention. Some creators have improved retention by cutting certain people out of their videos entirely, choosing the video's success over personal feelings.
Always introduce new characters with a name tag or brief title. Viewers who have to figure out who someone is and why they're there are spending cognitive effort on logistics instead of being immersed in the content. That cognitive load directly reduces retention.
Creators obsess over visuals for audience retention. Almost nobody talks about sound design, even though it has a measurable effect on how long people watch.
Silence before reveals. Most creators think silence is bad for audience retention. But a brief moment of complete silence right before a major reveal creates contrast that makes the next moment hit harder. The brain expects continuous audio. When it disappears for 1-2 seconds, attention spikes. The reveal that follows lands with more impact, which improves satisfaction and audience retention.
Risers to build anticipation. A subtle audio riser (a gradually building sound) before a key moment creates a sense of "something is coming." Many creators skip this and let reveals happen flat. Even a short riser makes viewers feel like the payoff was worth waiting for, which keeps them watching through the next section.
Consistent volume throughout. Sudden jumps in music volume break immersion. Viewers who have to reach for their volume slider are no longer passively absorbed in your content. They're managing a device. That momentary break in immersion makes them more likely to evaluate whether they want to keep watching. Keep audio levels smooth. Let viewers forget they're choosing to watch.
Music choice signals pacing. Viewers subconsciously read the music as a pacing signal. If the music builds tension, they expect something to happen. If the music relaxes, they expect a breather. Mismatches between music pacing and content pacing confuse viewers and reduce audience retention. When you want viewers to feel urgency, the music should build. When you deliver a payoff, the music should resolve. This alignment keeps the emotional experience coherent.
In educational content, how seriously viewers take your expertise directly affects how long they're willing to watch. A finance creator who doesn't appear financially successful will struggle to hold retention because viewers question why they should spend time on advice from someone who doesn't seem to live it.
This isn't about faking credentials. It's about understanding that viewers make a rapid judgment in the first 30 seconds about whether you're worth listening to. Specialized language used sparingly (with text boxes defining terms for non-experts) signals expertise and separates you from creators who only cover topics at the surface level. The balance is important: too much jargon becomes a barrier, but zero specialized language makes you seem like you're repeating what you read elsewhere.
For any educational content, the perceived authority question is: "Does this person seem like they actually know more than me?" If the answer feels like no, the viewer leaves. If the answer feels like yes, they'll tolerate slower pacing, longer videos, and less polished production because they believe the information is worth their time. That belief is directly reflected in your retention curve.
Every video has moments that are slower than others. Context needs to be delivered. Transitions need to happen. Not every second can be a peak moment. The question is: how do you retain viewers through those necessary slower sections?
The answer is unpredictability. When viewers have already seen one or two unexpected moments earlier in a video, they develop an expectation that something surprising could happen at any time. That anticipation carries them through sections that would otherwise lose their attention. They stay because leaving means potentially missing the next unexpected moment.
This works because the brain is wired to pay attention when outcomes are uncertain. Predictable content lets the brain relax and disengage. Unpredictable content keeps it alert. You can plan for unpredictable moments. They don't need to be genuinely unplanned. Things going "wrong," unscripted reactions, detours from the expected path, or elements the viewer didn't anticipate from your typical format all create the feeling that anything could happen. That feeling is one of the most powerful retention tools you have.
The key constraint: unexpected moments need to serve the story. If they feel random or disconnected from the video's goal, they confuse viewers instead of engaging them. The best unpredictable moments either add an obstacle to the goal, create a new piece of tension, or deliver an unexpected payoff. As long as they move the story forward, they make the whole video feel more alive.
Everything above this section is about fixing audience retention problems. This section is about preventing them before you create.
The audience retention strategies that work for a 20-minute true crime documentary don't apply to a 5-minute cooking tutorial. Applying the wrong tactics to the wrong content type wastes effort. Before optimizing, you need to know what actually holds attention in your specific category.
Every niche has videos that dramatically outperformed their channel's average. These outliers didn't just get more clicks. They held viewers longer, which is why the algorithm pushed them further.
Find outliers manually: sort competitor channels by "Most Popular" and study what those top videos have in common. Look at their length, intro style, pacing, editing approach, and format. Pay attention to what format dominates the top performers. That format is what your niche's audience prefers for sustained viewing.
For research at scale, TubeLab's outlier finder searches millions of verified videos filtered by:
If the same format, topic angle, and duration keep appearing in the outlier data, that's a strong signal about what retains viewers in your niche. Finding this pattern before creating saves months of guessing.
Before filming, cross-reference your research:
Check the niche. TubeLab's niche finder shows saturation, CPM estimates, growth trends, top-performing channels, and ideal video lengths for any YouTube category.
Check competitors. The free TubeLab Chrome Extension shows monetization status, RPM estimates, and video performance data on any channel while you browse YouTube.
Check outliers. TubeLab's outlier finder reveals which topics, formats, and durations are outperforming in your category right now.
Check title alignment. TubeLab's title formula tool analyzes millions of viral titles to surface character counts, emotional triggers, and structural patterns by niche. Titles that set accurate expectations lead to better audience retention because viewers get what they clicked for.
This research takes 30 minutes. It can save months of creating content in a format your audience won't watch long enough to build retention.
What is a good YouTube audience retention rate? It depends on video length. For videos under 5 minutes, 50-70% retention is healthy. For 5-10 minutes, 40-55%. For 10-20 minutes, 35-45%. For 20+ minutes, 25-35%. The platform average is just 23.7%, so anything above 30% puts you ahead of most creators. Educational content has the highest average retention at 42.1%. Vlogs sit lowest at 21.5%.
How does YouTube audience retention affect the algorithm in 2026? Audience retention is the primary quality signal, but in 2025-2026 YouTube added satisfaction signals on top: post-watch surveys, repeat viewing, session continuation, shares, and comment sentiment. High retention still matters, but videos that leave viewers feeling satisfied get additional distribution. Channels improving audience retention by 10 points see 25%+ more impressions.
Where do I find my YouTube audience retention data? YouTube Studio: Content > select a video > Analytics > Engagement tab. The audience retention graph shows where viewers stayed, left, rewatched, or skipped. You need at least 60 seconds of video and 100 views. Click "See More" to compare against similar-length videos and view breakdowns by new vs returning viewers and subscribers vs non-subscribers.
Does YouTube audience retention affect monetization? Indirectly, yes. Higher retention leads to more algorithmic distribution, more views, and more watch time. YouTube monetization requires 4,000 hours of watch time in 12 months. Better retention reaches that threshold faster. Once monetized, higher retention means viewers see more ads and generate more revenue per video.
What's the most common cause of low YouTube audience retention? The first 30 seconds. 55% of viewers leave within the first minute. If your intro doesn't confirm the click promise, retention drops immediately. After the intro, the most common killer is segmentation loss: long transitions between segments where the story loses momentum and viewers lose interest.
Should I make shorter videos to improve audience retention? Not necessarily. A tight 8-minute video with 50% audience retention generates more total watch time per viewer than a 3-minute video with 70% audience retention. YouTube's own docs confirm there's no optimal video length. Make videos as long as the content supports. Cut ruthlessly so every minute earns its place.
How can pattern interrupts improve YouTube audience retention? Pattern interrupts (visual or audio changes) reset attention every 60-90 seconds. A camera angle cut, B-roll clip, graphic overlay, or zoom cut prevents viewers from drifting into passive mode. 55% of viewers leave in the first minute of any video. Pattern interrupts reduce that drop. But they alone don't fix retention. They prevent attention decay while your content, pacing, and storytelling do the actual retention work.
How do I find what video format retains best in my niche? Study outlier videos. Sort competitor channels by "Most Popular" and note which videos dramatically outperformed. Look at format, length, and editing style. For research across hundreds of channels, TubeLab's outlier finder searches millions of videos filtered by niche, performance multiplier, and duration to reveal high-retention formats.
Does YouTube audience retention differ for Shorts? Yes. Shorts have higher audience retention standards because they're shorter. Aim for 70%+ as a baseline. Since March 2025, YouTube counts "engaged views" (where the viewer actively chose to watch) as the primary metric. Shorts that loop, achieving over 100% average view duration, signal extremely high satisfaction and receive more distribution.
Can I improve audience retention on already-published videos? You can't edit content without re-uploading (which resets metrics). But you can update thumbnails and titles to attract a better-matched audience, which improves retention on future views. YouTube's recommendation documentation confirms that changing titles/thumbnails affects viewer interaction, which the system responds to. Study your audience retention data from existing videos and apply those lessons to your next upload.
YouTube Help - Measure Key Moments for Audience Retention - Official documentation on the four types of audience retention graph moments (flat lines, gradual declines, spikes, dips), how to view audience retention by segment type, and metric definitions for average view duration and watch time.
YouTube Help - Search & Discovery Tips for Creators - YouTube's official confirmation that "our systems use both avg. view duration and avg. % viewed as signals to inform ranking" and that post-watch survey results factor into ranking alongside audience retention.
YouTube Help - How YouTube Recommendations Work - Official explanation of recommendation signals including watch history, satisfaction surveys, likes, dislikes, and "not interested" feedback.
YouTube Help - Discovery and Performance FAQs - YouTube's official statement: "The system learns how much of the video the viewer watches and if they're satisfied."
YouTube Help - Good to Know About Recommendations - Official documentation confirming no optimal video length and that changing titles/thumbnails affects performance through viewer behavior, not algorithmic penalty.
YouTube Blog - Neal Mohan's 2026 Letter: The Future of YouTube - YouTube CEO's 2026 priorities including 200B daily Shorts views, platform investment in recommendation quality, and the creator economy's growth.
CNBC - YouTube Chief Says 'Managing AI Slop' Is a Priority for 2026 - Reporting on Neal Mohan's annual letter and YouTube's investment in recommendation quality.
Retention Rabbit - 2025 YouTube Audience Retention Benchmark Report - Third-party benchmark data covering 10,000+ videos across 75+ niches: 23.7% average audience retention, 55% first-minute drop-off, audience retention by niche and video length.
TubeLab - YouTube Retention Cheatsheet - Visual guide to the six common audience retention graph shapes and diagnostic approach for each pattern.
Audience retention improves when you stop guessing and start studying what works. Learn to read your retention graphs. Fix the specific moments where viewers drop off. And before creating new content, research what formats, topics, and video lengths hold attention in your niche.
The TubeLab Chrome Extension is free and requires no account. Install it to check any competitor's video performance, monetization status, and RPM estimates while browsing YouTube. Understanding what works in your niche starts with seeing the data on every video you watch.
For deeper research, the full TubeLab platform ($178.80/year) includes the outlier finder across millions of verified videos, the niche finder with saturation metrics and CPM data, title formula analysis, channel search across 400K+ channels, and API access for custom workflows and n8n automation. No tiers, no feature gating, no upsells. The deepest annual discount in the category at 49% off monthly pricing.